PollSee Simulations

let's put the neighborhood in the room before it's decided.

Know how a community will react before you commit capital. PollSee shows you where a zip code's verified residents stand, so you can site, build, or pass something they will back.

Zip 11103 · AstoriaIllustrative · blocs, not people
86%Accuracy across 30 forecasts
380+Verified residents per zip
30Parameters per person
FiledAnd timestamped before the vote
As featured in TechCrunchStartup Battlefield 200 Authority MagazineInterview with our founder Tech:NYCNYC govtech companies to watch
What it is

a neighborhood's position, on the record.

Every day, residents open the free PollSee app and take a side on the real bills moving where they live, in plain English, and propose laws of their own. Each one verified their ID. Nobody is paid to answer. They show up because they want something changed, which is why what they tell us holds up.

PollSee adds those positions together by zip code, strips out anything that points to a person, and never reports a group smaller than five. We work with teams deciding where to site a project, how to shape a bill, and whether a plan will hold once the neighbors hear about it.

66local legislatures
50state legislatures
1Congress
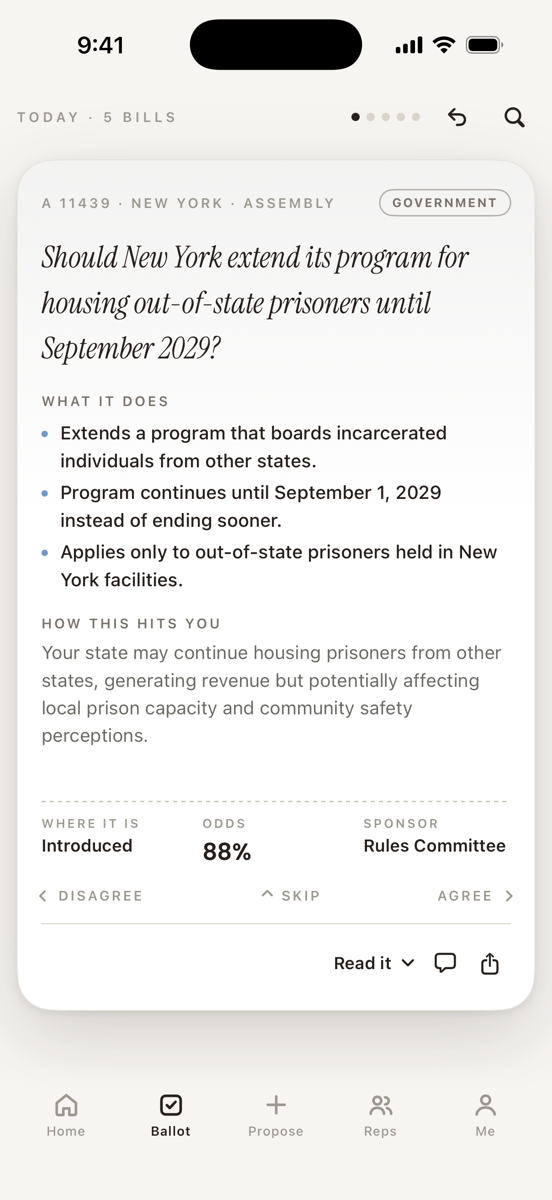
The PollSee app: a New York Assembly bill in plain English, with what it does, how it hits you, and the odds it passes
How it works

useful at every stage of one decision.

  1. 01 · Before you commit

    Siting & development

    Read how a zip code will react to a project before you file for it, and what would change the answer.

    Will this zip fight a data center, and what would make them support it?

  2. 02 · While you shape it

    Finding the version that holds

    Put the options in front of the people who live with the result, and see which one they get behind.

    Which of our candidate sites meets the least resistance from the people next to it?

  3. 03 · Before the vote

    Bill forecasting

    The odds a bill survives each gate, the one member whose position moves it, and the date the window closes.

    Does this bill clear committee this session, and which member decides it?

  4. 04 · After it lands

    Keeping the read current

    Who lives in a zip code now, what they are asking for, and where they are moving.

    Who actually lives in this district now, and what are they asking for?

What a simulation returns

three answers, every time.

Does it pass

Staged by gate

A probability for each procedural gate, not one number. Most bills die at a gate, not a vote, so you see where the risk actually is.

Who moves it

One name

The member whose position is most movable and most load-bearing. Spend usually gets wasted on the wrong person, not the wrong argument.

When to engage

A date, not a vibe

The date the odds change and what they change to, so timing is a decision instead of a guess.

Simulation / zip 11103 Filed
Tested Protected bike lanes on 31st Street
Population ID-verified residents of zip 11103, Astoria
Resident blocs on file
74%

Share of the zip's blocs with positions on related bills

Council personas
58%

Share of the committee whose voting record is modeled

Prediction
Clears committee71%
Move first onMember, District 22
Window closesHearing, Mar 1

Illustrative output. Every simulation also states the population and confidence behind it.

Case studies

what one simulation changed.

Testing community benefit packages for a Texas data center A Texas data center developer (anonymized) · 30 MW · 14-day turnaround
The problem

The developer was already paying for outreach and ads, and local opposition was still strong. Picking the wrong benefits package would cost more than the package itself, in lost trust and a slower approval. A traditional poll meant $15,000 a survey, months of fieldwork, and low response in a small town.

What the simulation said

For a town of about 20,000, PollSee built 5,000 representative digital twins from census, public, and first-party data, and polled each one 100 times on four packages. Direct dividends to residents won with 78% support, 44 points ahead of the next option.

What they changed

The developer chose to lead with direct dividends and is shaping its outreach around that package. Middle-aged personas moved the most: retirement planning and side income made money in hand beat longer-term promises.

The outcome

An estimated 3 months of surveying and $115,000 saved compared with traditional polling. Persona representativeness for this study: 76%. Net approval is still being measured.

Support for each package, tested separately
  • A. Direct resident dividendsA payout to people who live near the data center78%
  • C. Local workforce and hiringTechnician training, college partnerships, hiring targets34%
  • D. Community benefit fundParks, broadband, schools, emergency services, sized to power draw21%
  • B. Fair share of property taxesLimit abatements, pay into local schools19%
Why it's different

a model of your town, not a generic panel.

Most synthetic panels are stock personas built from surveys and scraped text. PollSee builds a representative model of the one place you're deciding about, from census, public, and first-party data, and tells you how closely it matches the real population.

A generic synthetic panelPollSee
Who's in itStock personas, reused from place to placeDigital twins built for one town, matched to its makeup
Built fromSurveys and scraped textCensus, public, and first-party data for that place
How it's runOne answer per personaEach twin asked 100 times per option, then compared
How sure it isRarely statedEvery study reports how representative its model is

And against a traditional survey

A traditional surveyPollSee
CostAbout $15K per survey$100,000 per zip code, per simulation
Response rateAbout 6% of the people askedEvery twin answers, so a small town still gets a full read
Time to answerMonths of fieldwork14 days in our Texas data center study
Changing the optionsField a new surveyRerun the model with the new options
The rules we run by

residents trust us with this. so can you.

Built for one place

Every simulation models the specific town or zip code you're deciding about. No stock personas carried over from somewhere else.

Aggregates only

No name, contact, or individual position ever leaves. Nothing is reported for a group smaller than five.

For deciding, never for persuading

A simulation helps you decide whether to do something, and how. It is never for working out how to manipulate the people in it.

Residents see it too

People can always see the combined results for their own zip code. If you ask how a neighborhood will react, the neighborhood gets the answer as well.

Filed before the vote

Forecasts are timestamped before the chamber acts and scored against the record after. The misses count too.

Coverage on every output

Every result says what population it modeled, how representative the model is, and how confident it is, so a thin zip code never passes for a deep one.

Residents read the same rules: how we use your data.

Pricing
$100,000
Per zip code, per simulation

Set that against what one stalled project costs you.

  • One zip code, modeled as a representative set of digital twins
  • One simulation: a siting read, a forecast, or a read on who lives there
  • The three answers, with the population and confidence behind them
  • Aggregates only: nothing leaves below a group of five people

Coverage runs deepest in New York City. Every simulation states how representative its model is, and a thin zip code returns a wider range instead of a guess.

Get started

tell us what you're deciding.

Tell us the decision, the zip codes, and what's at stake. We'll show you what a simulation returns before you commit to anything.